

From Code
From Code reads the source you paste, automatically detects its type, and converts it into an editable diagram. It lays out the services, tables, resources, and the relationships between them on its own. It requires no AI; all parsing runs entirely in your browser, offline, and standalone.
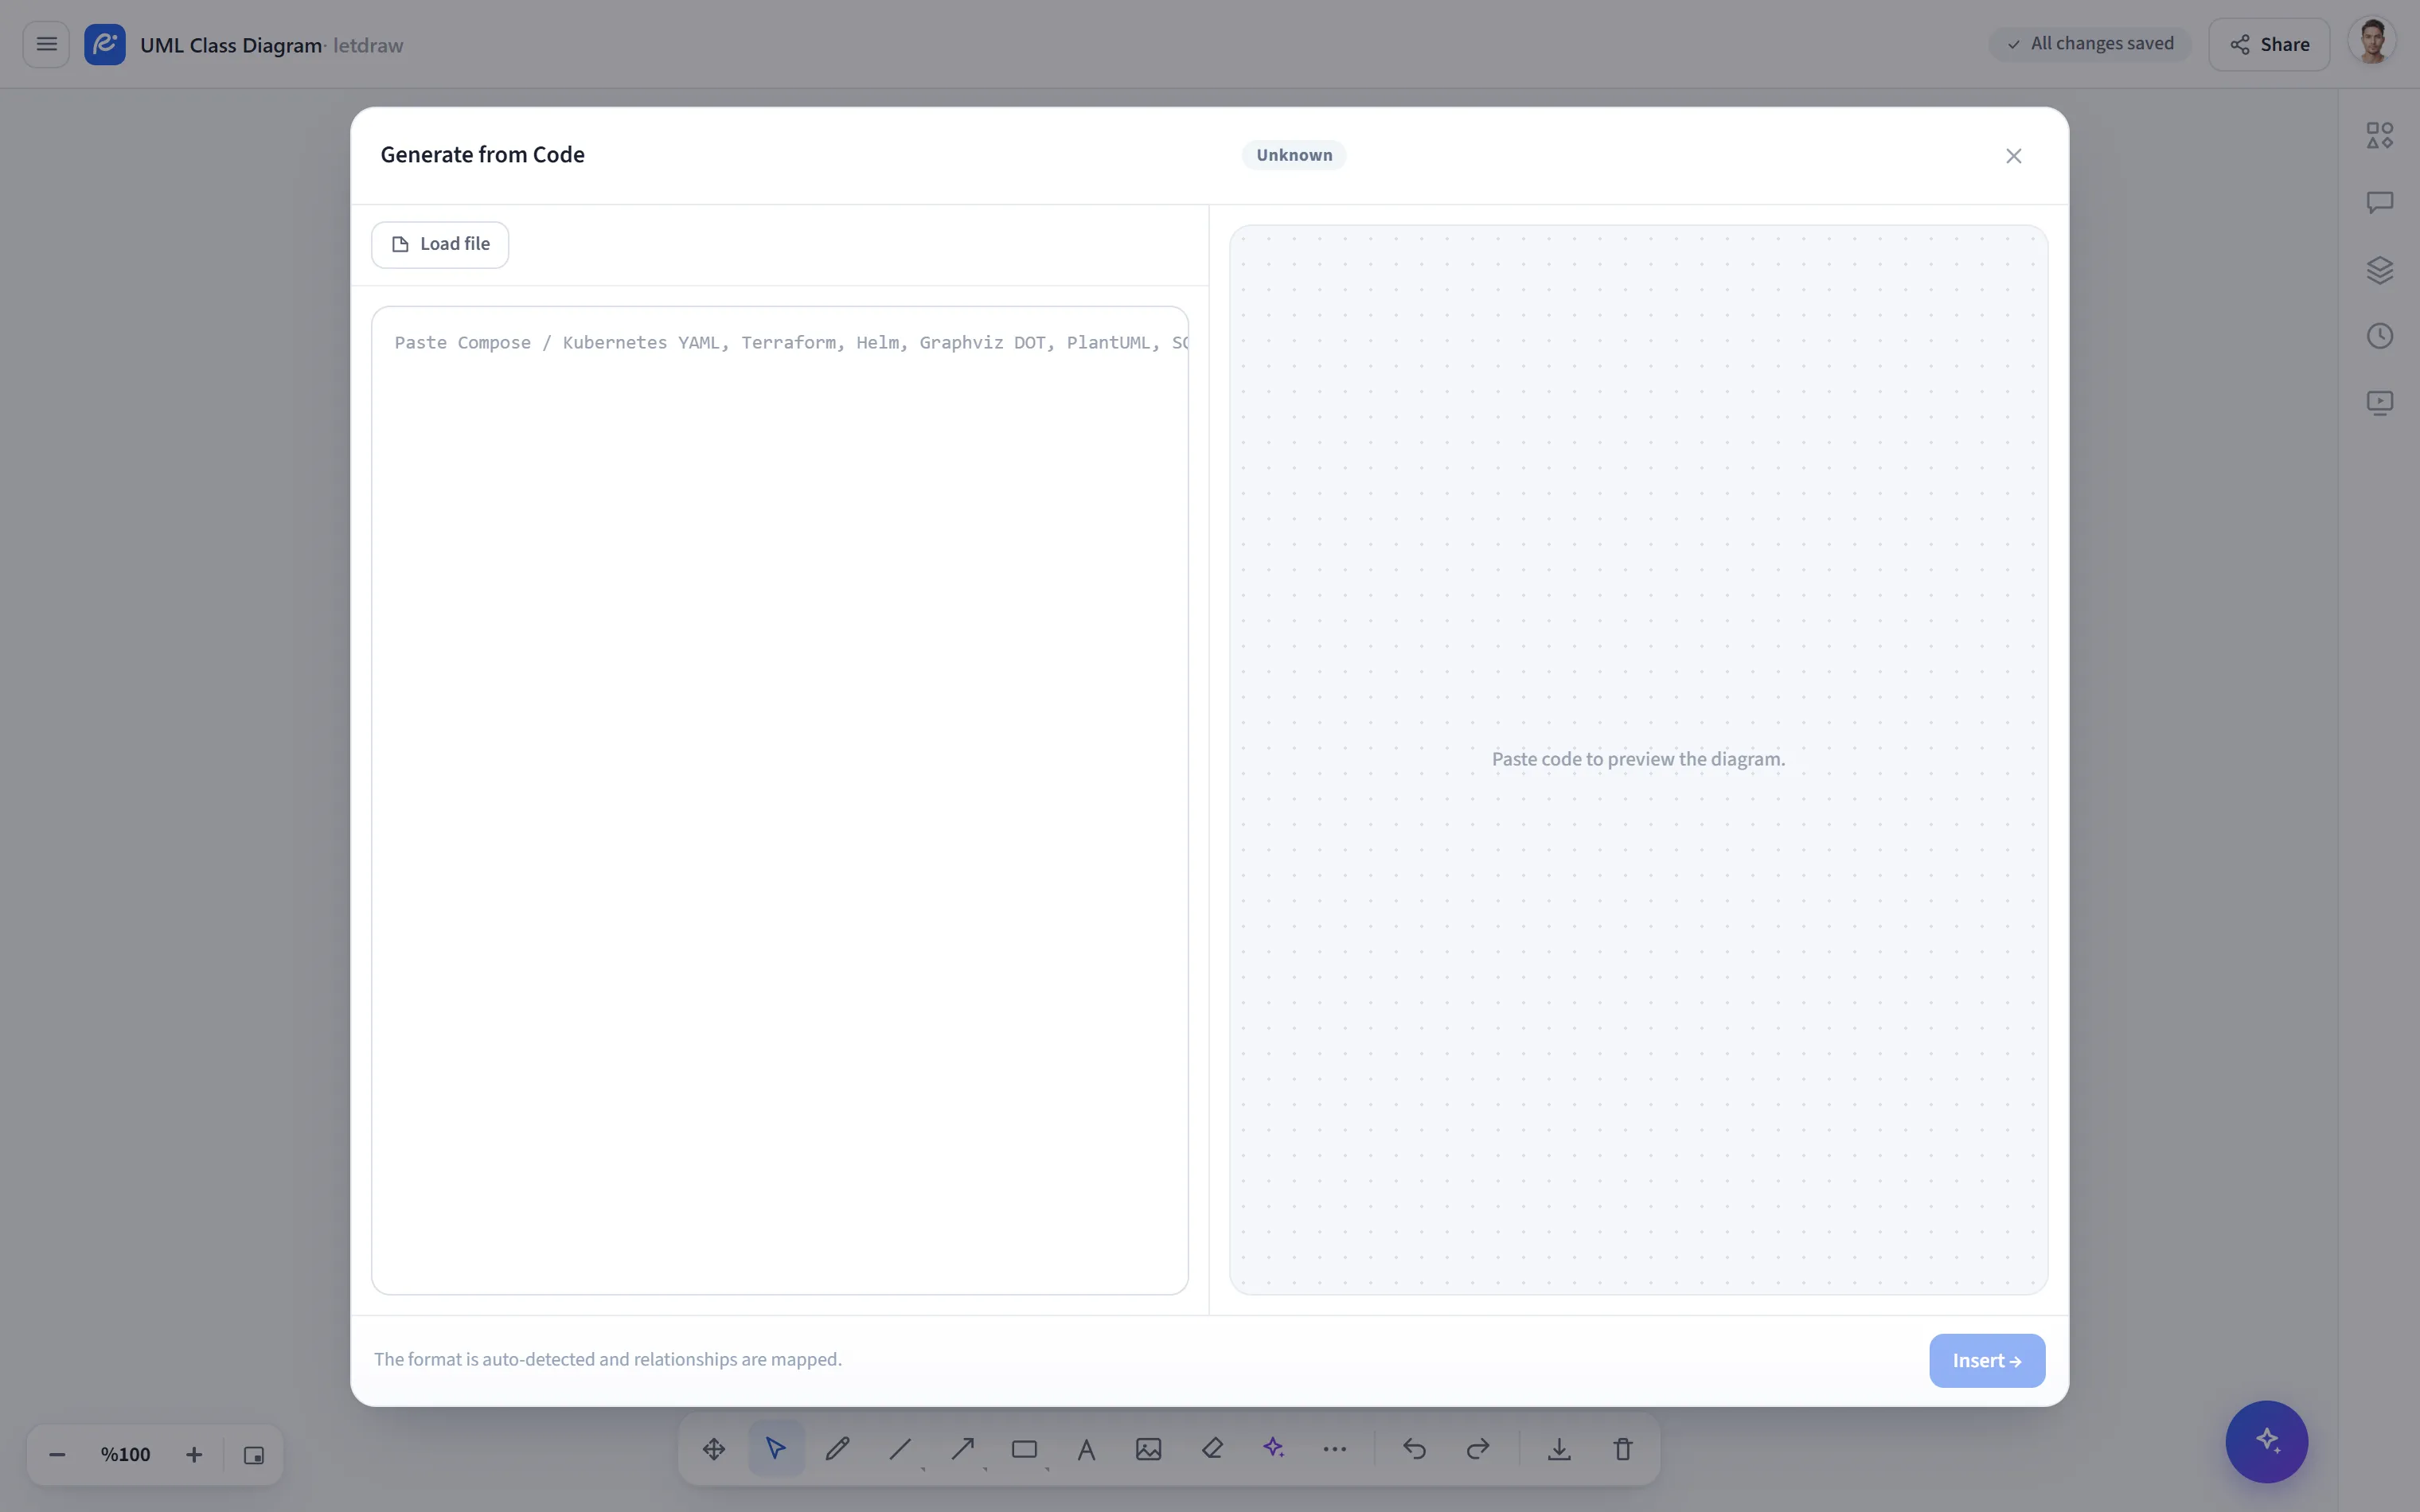
How to open
Section titled “How to open”In the bottom toolbar, More tools (⋯) → From Code.
Supported formats
Section titled “Supported formats”When you paste your source, a badge showing the detected type appears at the top of the dialog. The following formats are recognized:
| Format | What it produces |
|---|---|
| Docker Compose (YAML) | Services, dependencies, networks, and volumes. |
| Kubernetes (YAML) | Resources such as Deployment, Service, Ingress, and their relationships. |
| Helm | Helm template/chart structure. |
Graphviz DOT (.dot / .gv) | Nodes and edges of the DOT graph. |
PlantUML (.puml / .plantuml / .iuml / .pu) | PlantUML diagram structure. |
Terraform (.tf / .hcl) | Terraform resources and dependencies. |
| SQL | An ER diagram with tables and foreign-key relationships. |
| EXPLAIN plan | Postgres/MySQL EXPLAIN JSON output as a query plan tree. |
| OpenAPI | Endpoints and schema relationships from an OpenAPI definition. |
| git log | A git graph from commits and branches. |
When text that cannot be recognized is entered, the badge reads “unknown” and a hint is shown.
How to use
Section titled “How to use”- Open More tools → From Code.
- Type or paste the source into the left box, or load it from a file with Upload file. The type is detected automatically.
- Check the live preview on the right; you can inspect it with the zoom controls.
- Click Insert to place the diagram on the canvas. The result is made of real, editable shapes.
Options
Section titled “Options”- Flow direction: lay out the diagram top-to-bottom (TB) or left-to-right (LR). (This option does not appear in the SQL → ER grid.)
- Drawing style and font: switch between clean/sketch drawing and handwritten/normal font; applies to both the preview and the inserted shapes.
- Relationship filters: if the graph has more than one relationship type, labeled chips appear that toggle each type individually.
- SQL relationship style: in an ER diagram, you can choose the relationship line as a straight line, straight arrow, smart arrow, or crow’s-foot.
- Comparison (drift): compares your current source against your previous insertion of the same type; it highlights added and removed nodes (+added / −removed) in color.
File upload
Section titled “File upload”The Upload file button accepts the following extensions: .yaml, .yml,
.txt, .dot, .gv, .puml, .plantuml, .iuml, .pu, .tf, .hcl.
- No key required; it works entirely offline.
- Node, connection, and group counts, along with any warnings, are shown at the bottom.
- Because the result is made of shapes, you can freely change its labels, colors, and layout afterward.