

Explain Diagram
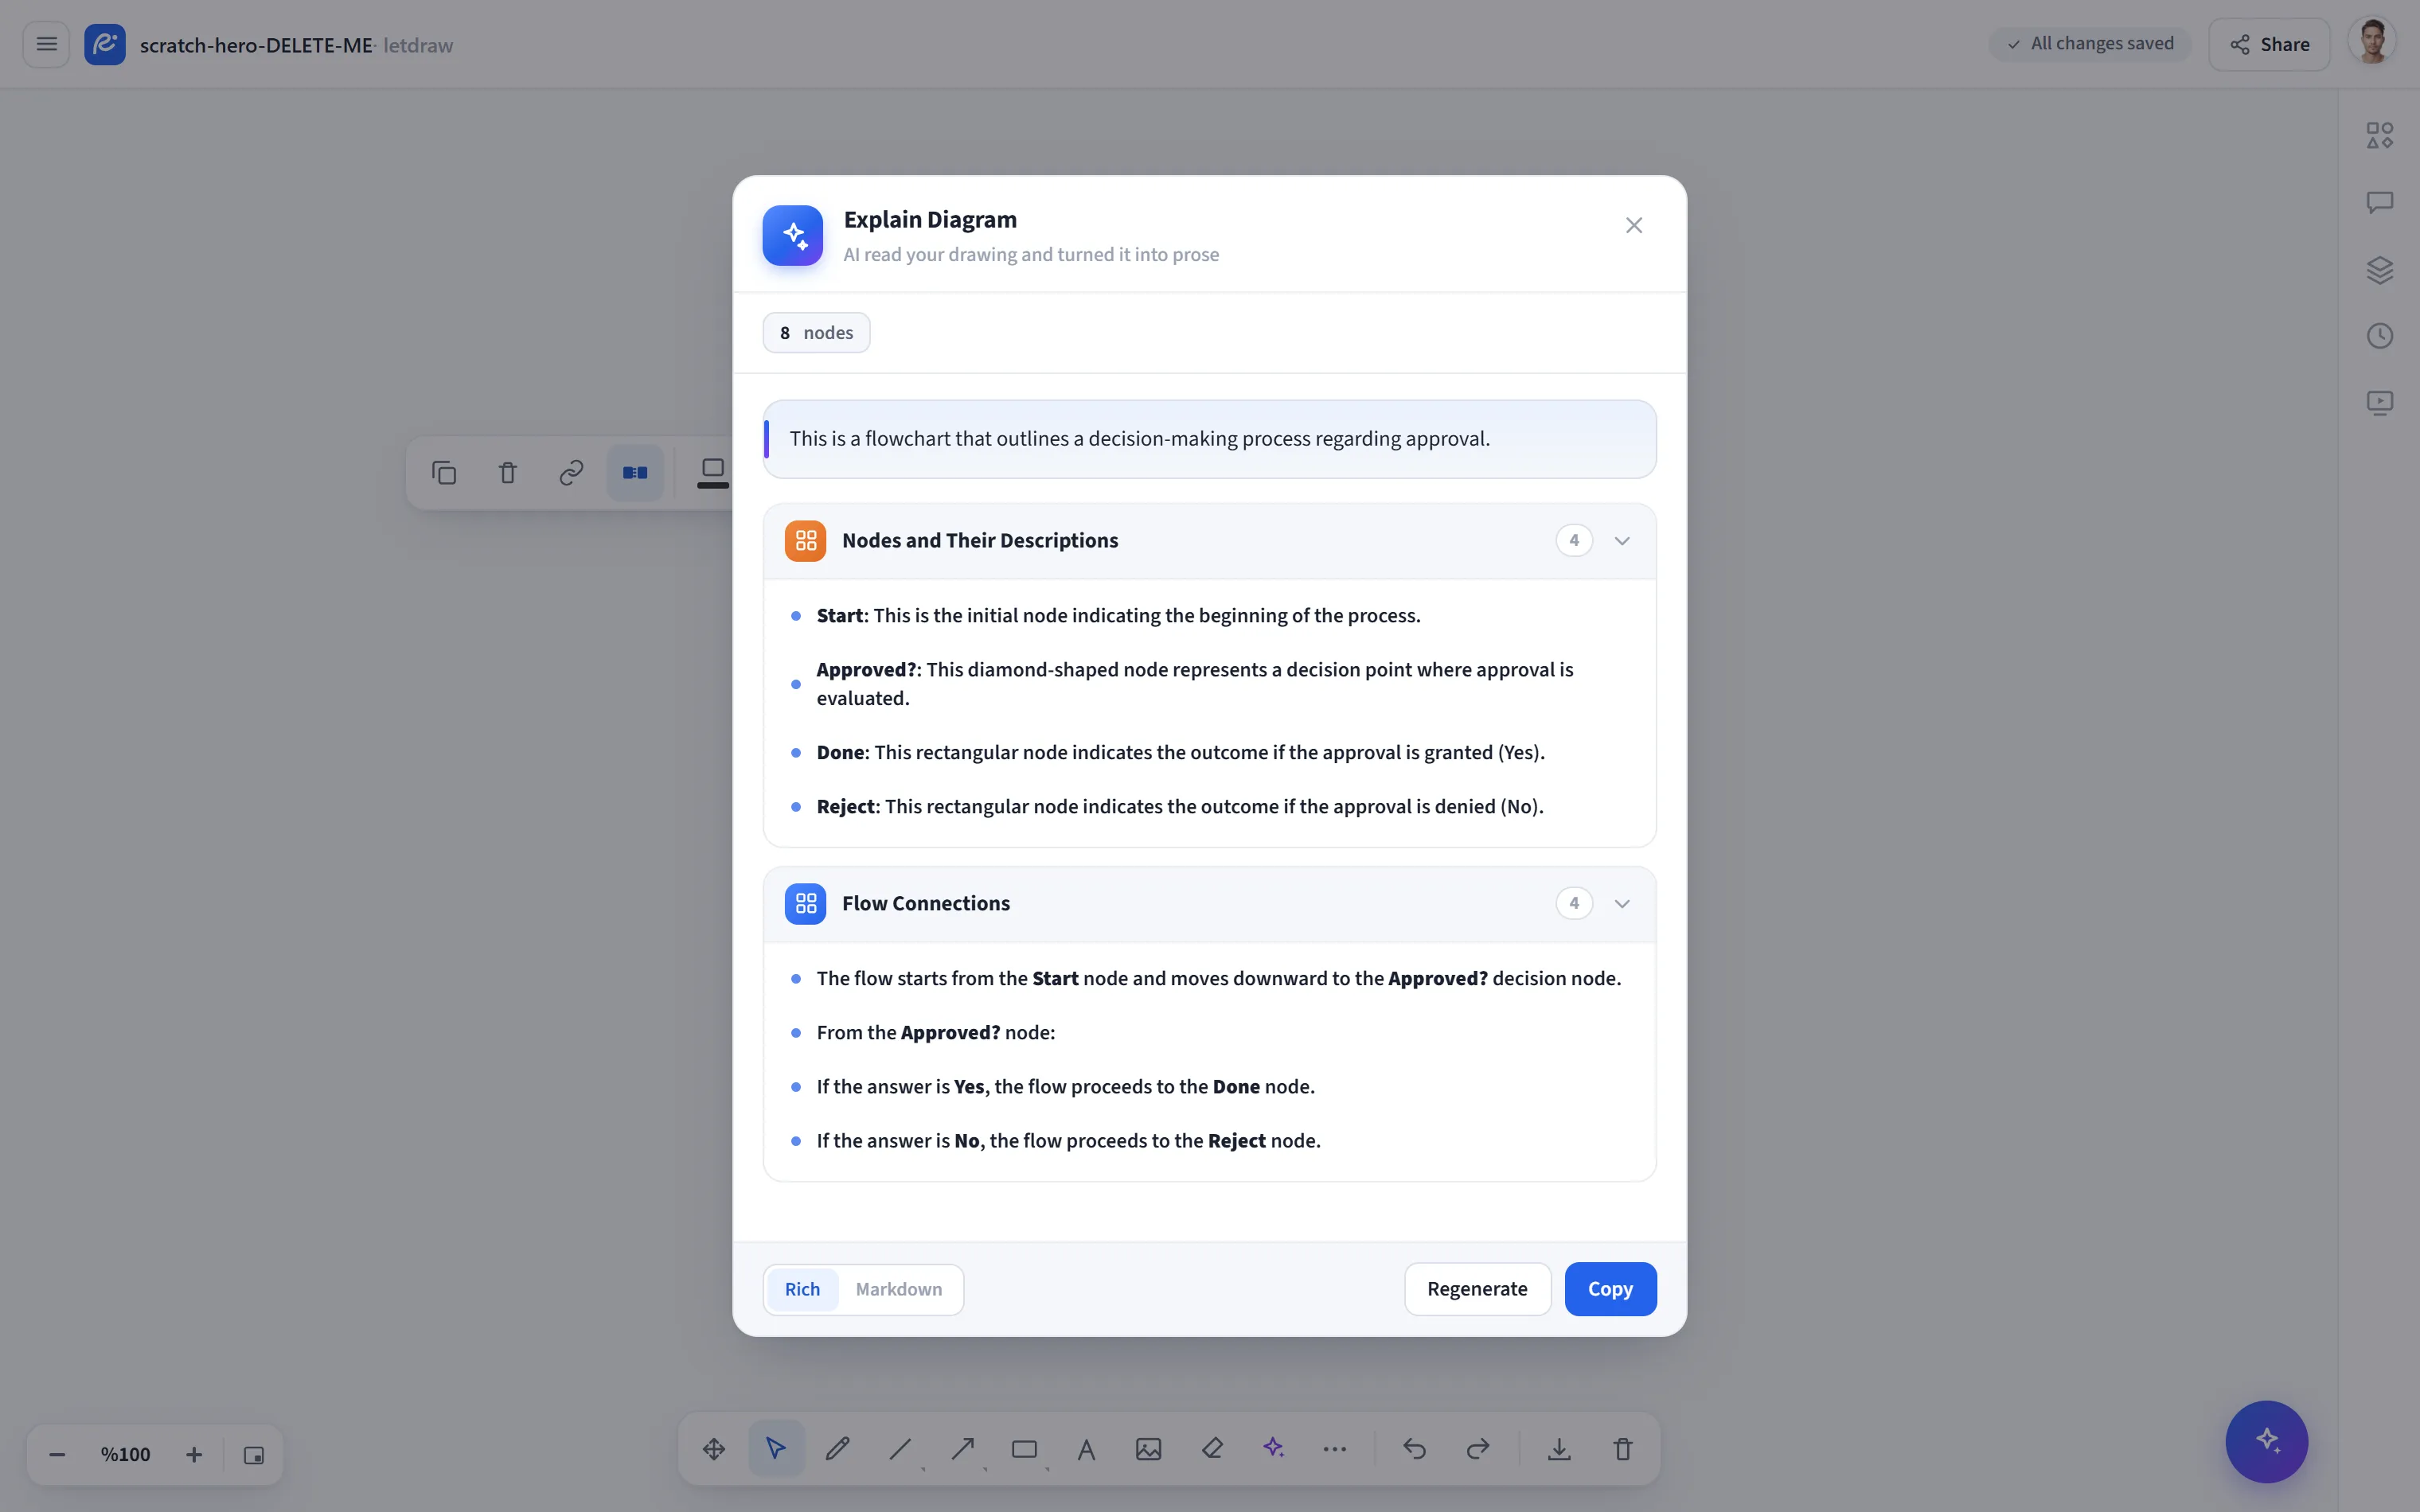
Explain Diagram reads a diagram on the canvas and turns it into a plain-text explanation: it summarizes what the diagram conveys, the relationships between boxes, and the flow. It is handy when preparing a presenter note, a README, or a PR description; in a sense it is the inverse of Prompt to diagram. The diagram is read as an image (rasterized), so freehand sketches and every diagram type are covered too.
How to open it
Section titled “How to open it”Click the AI and diagram tools button (✦) in the bottom toolbar and choose Explain Diagram from the menu. If there is no shape on the canvas, this item appears disabled.
How to use it
Section titled “How to use it”- Select the shapes you want to explain. If nothing is selected, the whole canvas is used. (Connected shapes produce a more consistent explanation.)
- Open AI and diagram tools → Explain Diagram. The explanation starts generating automatically.
- You can view the result in two formats:
- Rich: a summary plus expandable/collapsible node cards grouped by category (the diagram type and node count are shown as a badge at the top).
- Markdown: the raw Markdown text.
- Use Copy to grab the text; use Regenerate to create the explanation again.
Provider and quota
Section titled “Provider and quota”- A provider that supports vision (image understanding) is required.
- Default: runs through the server we host, no extra key needed.
- Your own key (BYOK): you can enter your own API key from AI Settings (OpenAI, Google Gemini, Claude, or OpenRouter). With your own key, the free request limit does not apply.
- Free plan: a free request allowance is granted on the operator server; the remaining allowance is shown at the top. When it runs out, you can upgrade to Pro or add your own key.
- If you want to explain only one section, select those shapes first, then open the tool.
- You can paste the generated Markdown directly into a document or a PR description.